
Frappé Charts
GitHub-inspired modern, intuitive and responsive charts with zero dependencies
Explore Demos »

Contents
Installation
-
Install via
npm:$ npm install frappe-chartsand include in your project:
import Chart from "frappe-charts/dist/frappe-charts.min.esm" -
...or include within your HTML
<script src="https://unpkg.com/frappe-charts@0.0.6/dist/frappe-charts.min.iife.js"></script>
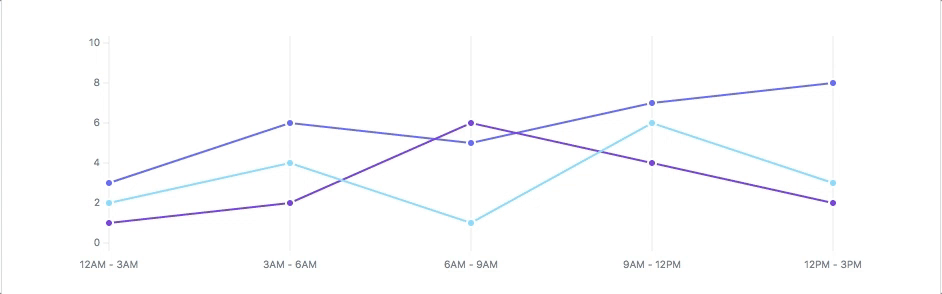
Usage
const data = {
    labels: ["12am-3am", "3am-6pm", "6am-9am", "9am-12am",
        "12pm-3pm", "3pm-6pm", "6pm-9pm", "9am-12am"
    ],
    datasets: [
        {
            title: "Some Data",
            color: "light-blue",
            values: [25, 40, 30, 35, 8, 52, 17, -4]
        },
        {
            title: "Another Set",
            color: "violet",
            values: [25, 50, -10, 15, 18, 32, 27, 14]
        }
    ]
}

const chart = new Chart({
    parent: '#chart', // or a DOM element
    title: "My Awesome Chart",
    data: data,
    type: 'bar', // or 'line', 'scatter', 'pie', 'percentage'
    height: 250
})
If you want to contribute:
- Clone this repo.
cdinto project directorynpm installnpm run dev
License
This repository has been released under the MIT License
Project maintained by Frappe. Used in ERPNext. Read the blog post.